Establishing a shared framework for understanding and improving Member Experience from the right data
Through the pandemic, customer adoption of digital-first healthcare services increased significantly and at an accelerated pace. In response, customer feedback on these digital tools also grew substantially, leading health plans to recognize the strategic business value that member satisfaction holds in influencing renewal rates.
For many organizations up to that point, the available tooling and analytic capabilities to truly understand member satisfaction had been limited primarily to behavior flow analysis tools such as Google Analytics. However, when used in isolation, health plan clients found themselves struggling to gain the comprehensive visibility required to effectively address points of customer friction. As members attempted to navigate the complexities of healthcare, the NPS surveys that appeared sporadically throughout various points of the member experience often misattributed client issues to incorrect parts of the journey.
Furthermore, the systems used to classify small qualitative data sets were generating a disproportionate sense of urgency around addressing product improvements, sometimes without enough context. Recognizing the critical strategic importance of understanding care access and cost throughout the entire end-to-end member journey in healthcare, clients turned to Zelis with a clear request: to develop a more effective and insightful method of understanding member experiences within our embedded platform.

Member confusion in healthcare is real
75%
of people on a family member’s job-based insurance reported feeling “completely lost” in trying to understand health insurance

Building a Member Experience Insights Engine based on the combined power of qualitative and quantitative data.
We brought together select clients from across the country to form a group that created a new way to measure our shared end customer. This group agreed on the full customer journey that is common to all of their businesses, focusing on where care and cost fit within the larger health plan member/patient experience. They agreed on customer goals and business results during the "shopping journey" to build a detailed member experience (Mx) measurement model. We then guided the design of a three-part model for measuring customers based on key "micro-journeys."
Within 6 months, we launched the “MX Index” using Pendo and PowerBI. The upgraded analytics solution captured member satisfaction along three dimensions (CSAT, GCR, CES) across 5 initial micro-journeys. This shared measurement architecture was made available to all clients which enabled us to generate an annual member satisfaction baseline and quarterly member experience insights reports for use internally with key internal stakeholders and for clients to use within their own organizations as they continued to advocate for customer-centered improvements.
Our new tools provided data and insights that became the foundation of our continuous discovery process. Each month, our UX Research and Design team held sessions with clients to openly discuss and review the results, helping us organize and prioritize product improvements.

Establishing a unified view of the “continuous improvement” value cycle
In consumer-facing white label solutions, changing elements of an experience can be complex—especially when those solutions are coordinated with other systems to deliver for the end users. Regional differences, account-specific needs, and product configurations all impact what the end user sees and how they experience the content available to them. Establishing a simplified data-driven continuous improvement value loop allowed the team to:
Focus on the user goal and ensure that the decisions being made help that end user accomplish a goal.
Consider the experience in relationship to other micro-journeys to ensure that decisions made to optimize one experience don’t erode another part of the journey.
Align and coordinate a nested consumer journey within a larger end-to-end experience
Shopping experience can be different for everyone. Age, plan type, technology savvy and other factors have an impact on how people react to stimulus and engage with tools. The S365 and SmartShopper member journeys nests within the heath plan journey.
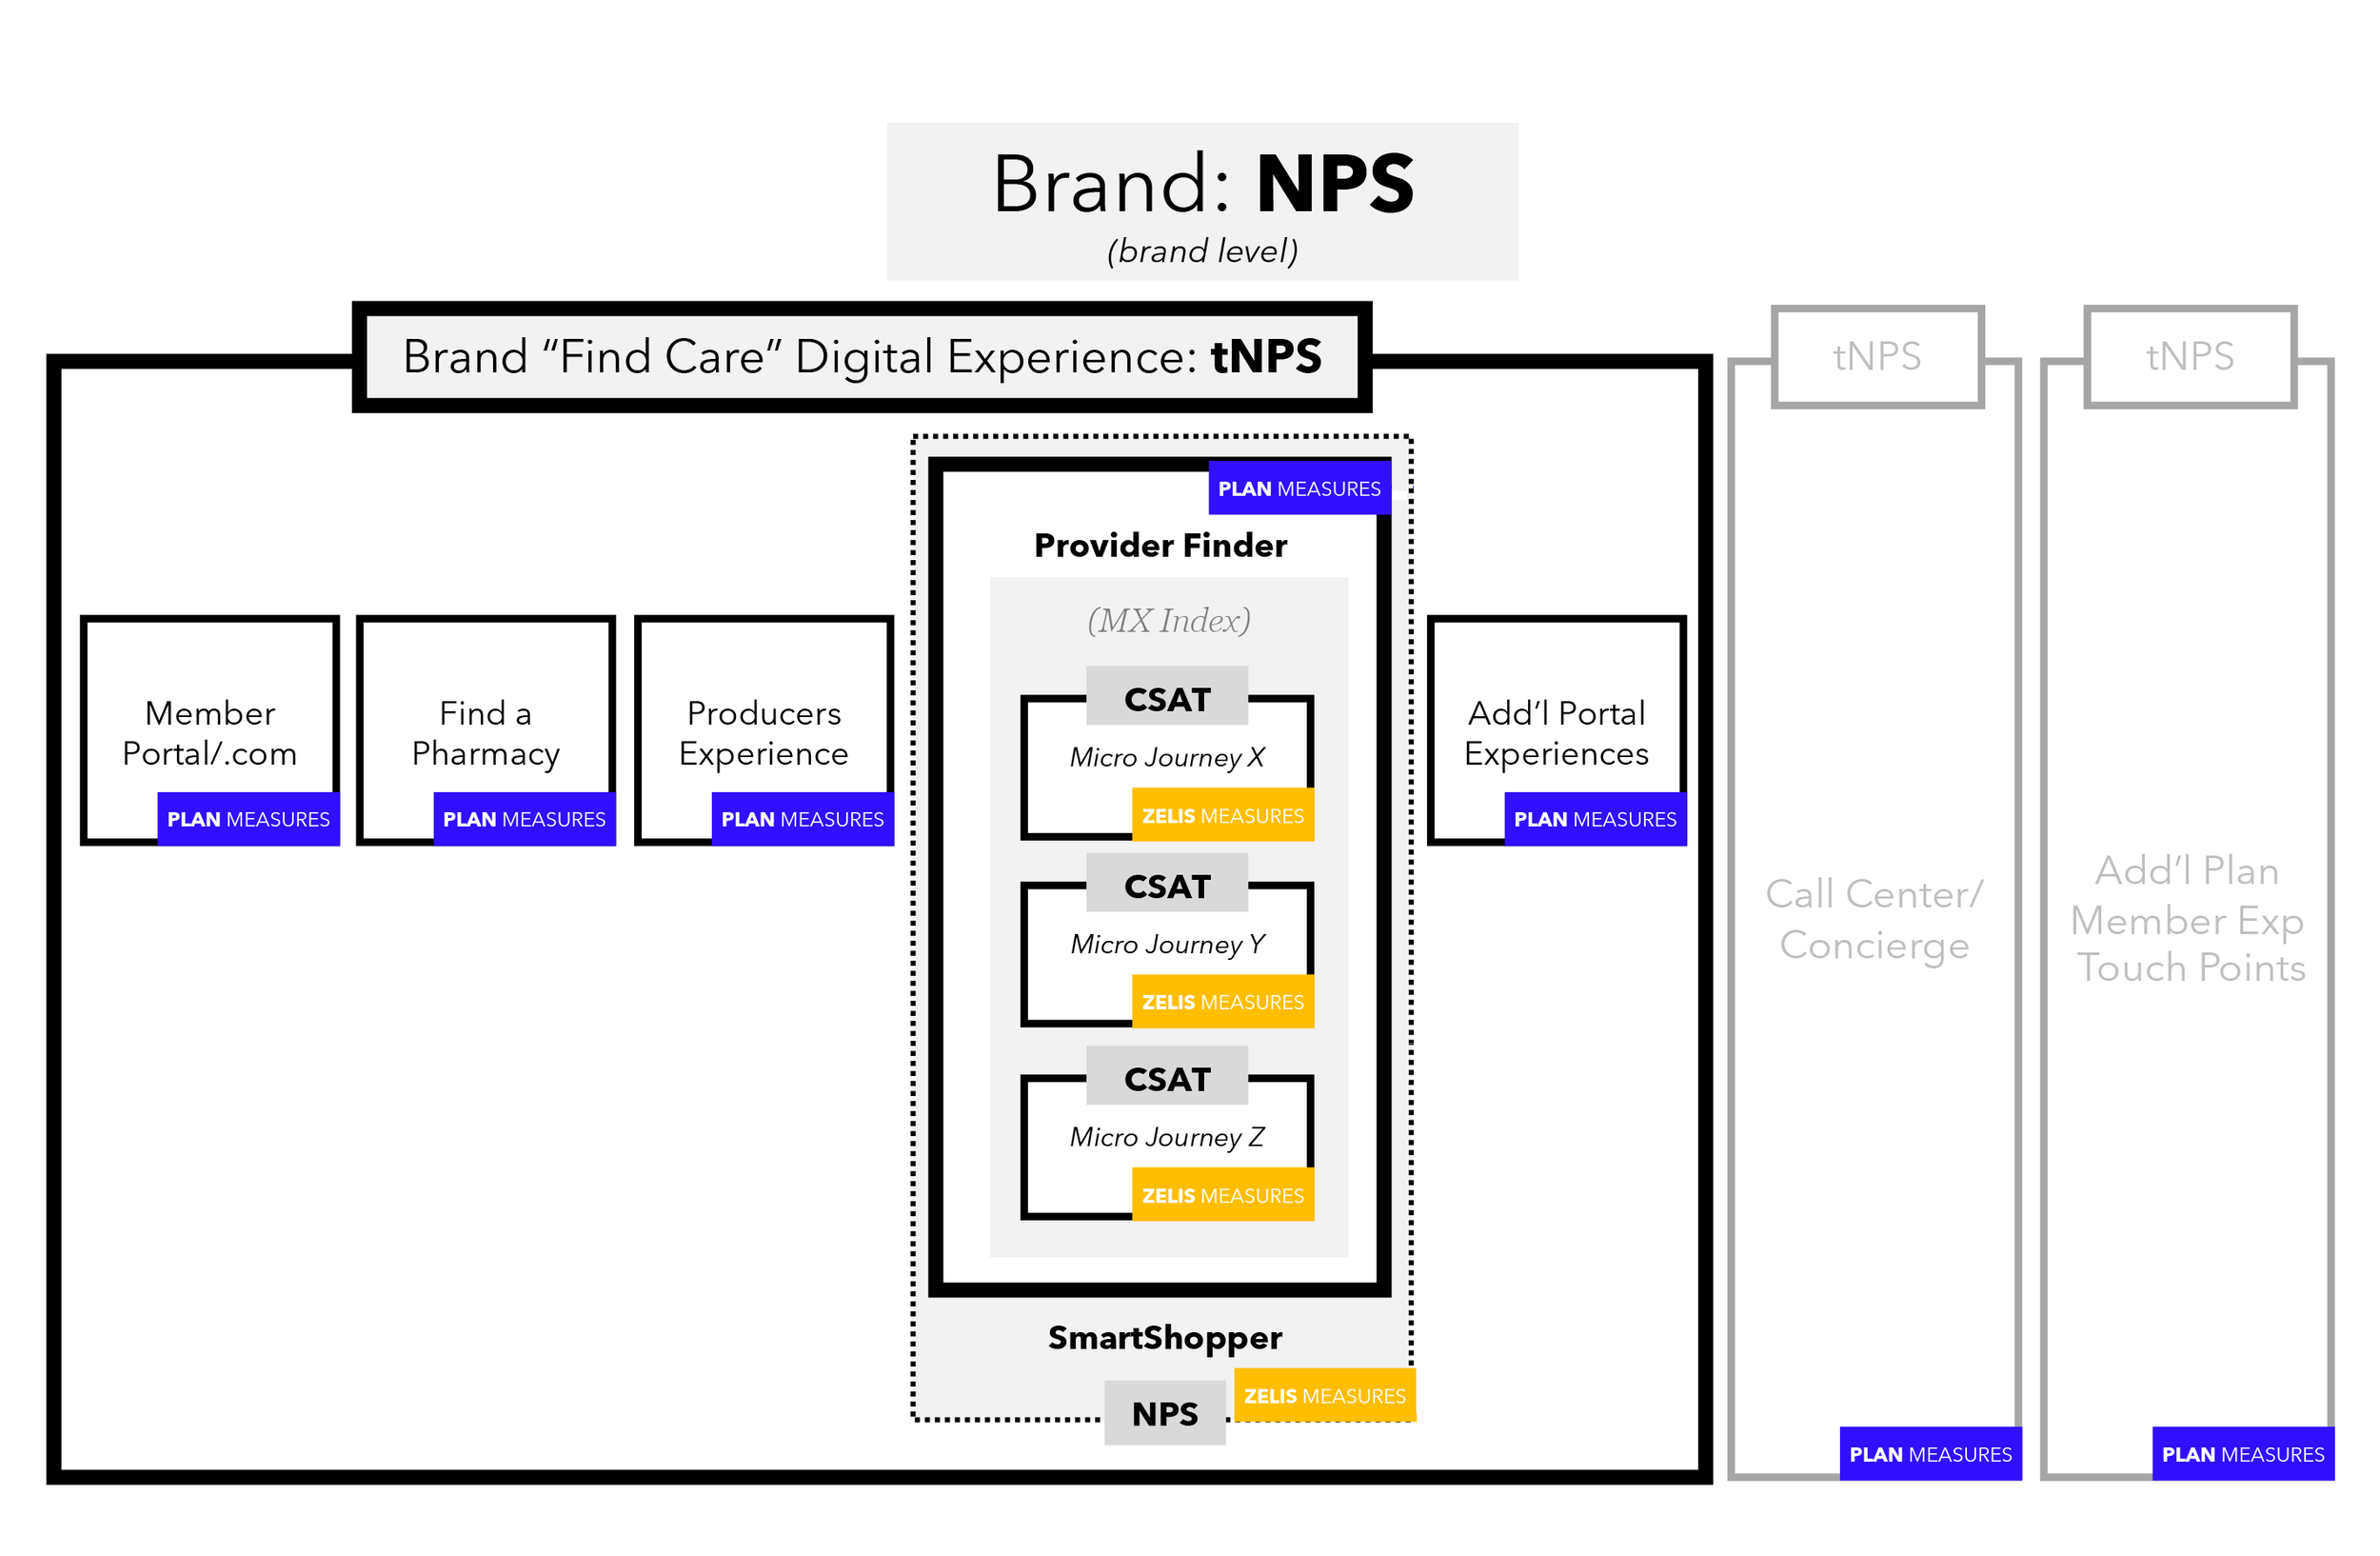
While plans measured tNPS of provider finder through surveys outside of S365, we worked to capture micro-journey CSAT and Goal Completion Rates (GCRs) to provide a bottom up quantitative baseline for plans to understand their own membership and the general satisfaction across the market for all plans using our solution. This nested model allowed plans to understand their users at three distinct layers:
The plan/client measures are captured outside of the S365 experience
Mx Index captures inside of the S365 experience
SmartShopper Program NPS creates additional signal on member satisfaction.

Establishing the Experience Levers for change within the system
To drive meaningful MX improvement, we defined that the member experience must be evaluated by looking at five interconnected levers to plan and prioritize change that has the most impact.
INHERITANCE ISSUES: Issues impacting member satisfaction with the provider finder experience starting before entry into S365.
EXAMPLES: SSO payload load time, portal placement and visibility
CONFIGURATION ISSUES: Config decisions related to feature functionality, messaging, or things like specialty mapping. EXAMPLE: business reason to not display OON providers in result set, specialty keyword mapping, confusing banner language
USER INTERFACE/USER EXPERIENCE ISSUES: The components, information hierarchy, content layout, or general accessibility of a page design are impacting a user’s ability to accomplish their goal(s).
DATA ISSUES: Data displayed within the UI components (both local and national) is either out of date, incorrect, or missing. EXAMPLE: Out of date ANP data
PERFORMANCE ISSUES: Issues with overall application performance from a code perspective (can be related to SLA and impacting SLOs and SLIs). EXAMPLES: latency issues, data won’t load
The Mx Index Improvement Cycle

Micro-journey-level Survey Placement

Continuous Discovery from Synthesis

Validated Improvements Delivered
Pendo Guide surveys placed at the end of the micro-journey allows for the highest likelihood of collecting accurate qualitative and quantitative information about the experience because it happens both in the in context of the outcome the member is seeking.
Product & Design adopted a shared "continuous discovery" methodology to support better alignment to strategy, an outcome-driven mindset, and clear visualization of opportunities and alternatives.
Prioritized and validated UI solutions are pulled through to the continuous improvement backlog and prioritized into the next available release.
Product Manager, Find Care at CareFirst
“The MX Index was instrumental in helping our leadership refocus our member experience improvement goals on the right measures. By having this better alternative, we were able to remove NPS from our executive metrics in favor of CSAT.”

Capability Product Manager, Premera
“These Mx Workshop discussions have been really great discussions, especially with the research orientation behind them rather than some time ago where they were more general discussions. Having it grounded in that research and what have you found and then giving us a chance to react to it and consider our reactions has been really valuable.”

Results
Outcomes
Demonstrated thought leadership and analysis for trends in our product.
Surfaced already available configurable features that clients may have missed in set up or day -to-day tool management.
Drove alignment between Zelis and client roadmaps for continuous improvement updates—bringing greater clarity to the specific category for improvement—inheritance, data, configuration, UI, performance.
Enabled Sales, Account Management, and ICS to drive client conversations about activating available features and capabilities correlated to their member satisfaction issues.
Validate UI concepts and drive client adoption for recommend experience improvements.
Surface UX research in the context of recommended improvements.
Recommend measurable roadmap candidates for the annual roadmap process
Key Measures within the First 6 Months of Launch
8 Health Plans onboarded enabling access to a potential 40M members
18.9K respondents across all live MX clients
558 user research participants (moderated & unmoderated) provided input on prioritized MX Index scopes
6,000 text responses with qualitative feedback
Established average baseline CSAT for finding care at 50
Shipped 8 prioritized data-driven continuous improvement scopes based on the results and client validation